Building a Production-Grade Homelab: Infrastructure, Kubernetes, and GitOps on a Repurposed Laptop
How I turned an old laptop into a fully functioning infrastructure lab — running Proxmox, a k3s Kubernetes cluster, a complete monitoring stack, and a GitOps pipeline with ArgoCD.
TL;DR Technical Overview: A self-hosted infrastructure lab running on a repurposed HP Elitebook with Proxmox as the hypervisor.
- k3s Kubernetes cluster (1 master + 2 workers) provisioned via Terraform and Ansible
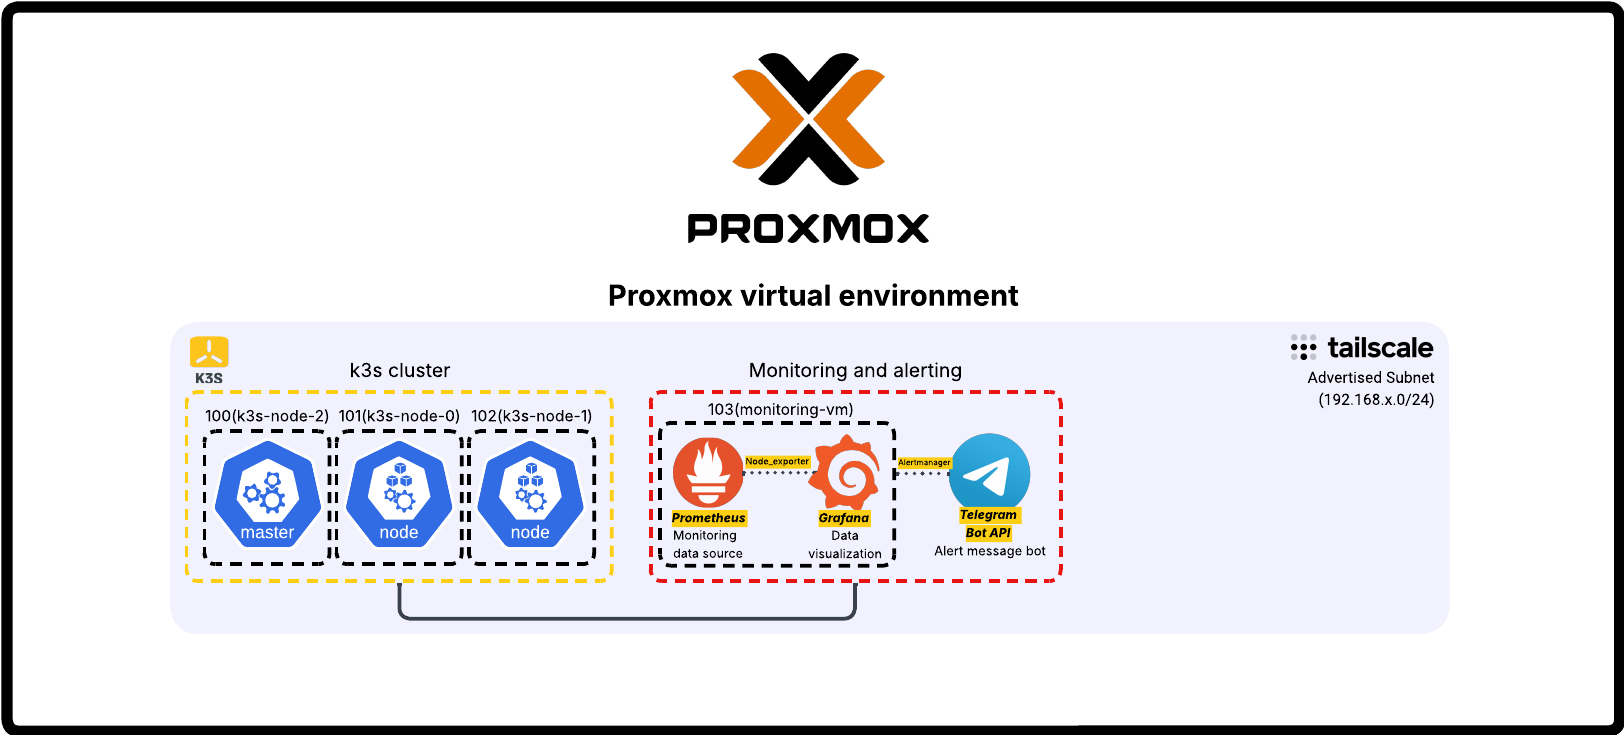
- Full monitoring stack: Prometheus, Grafana, Alertmanager with Telegram-based alerting
- GitOps pipeline: ArgoCD managing deployments from a GitHub repository with App-of-Apps structure
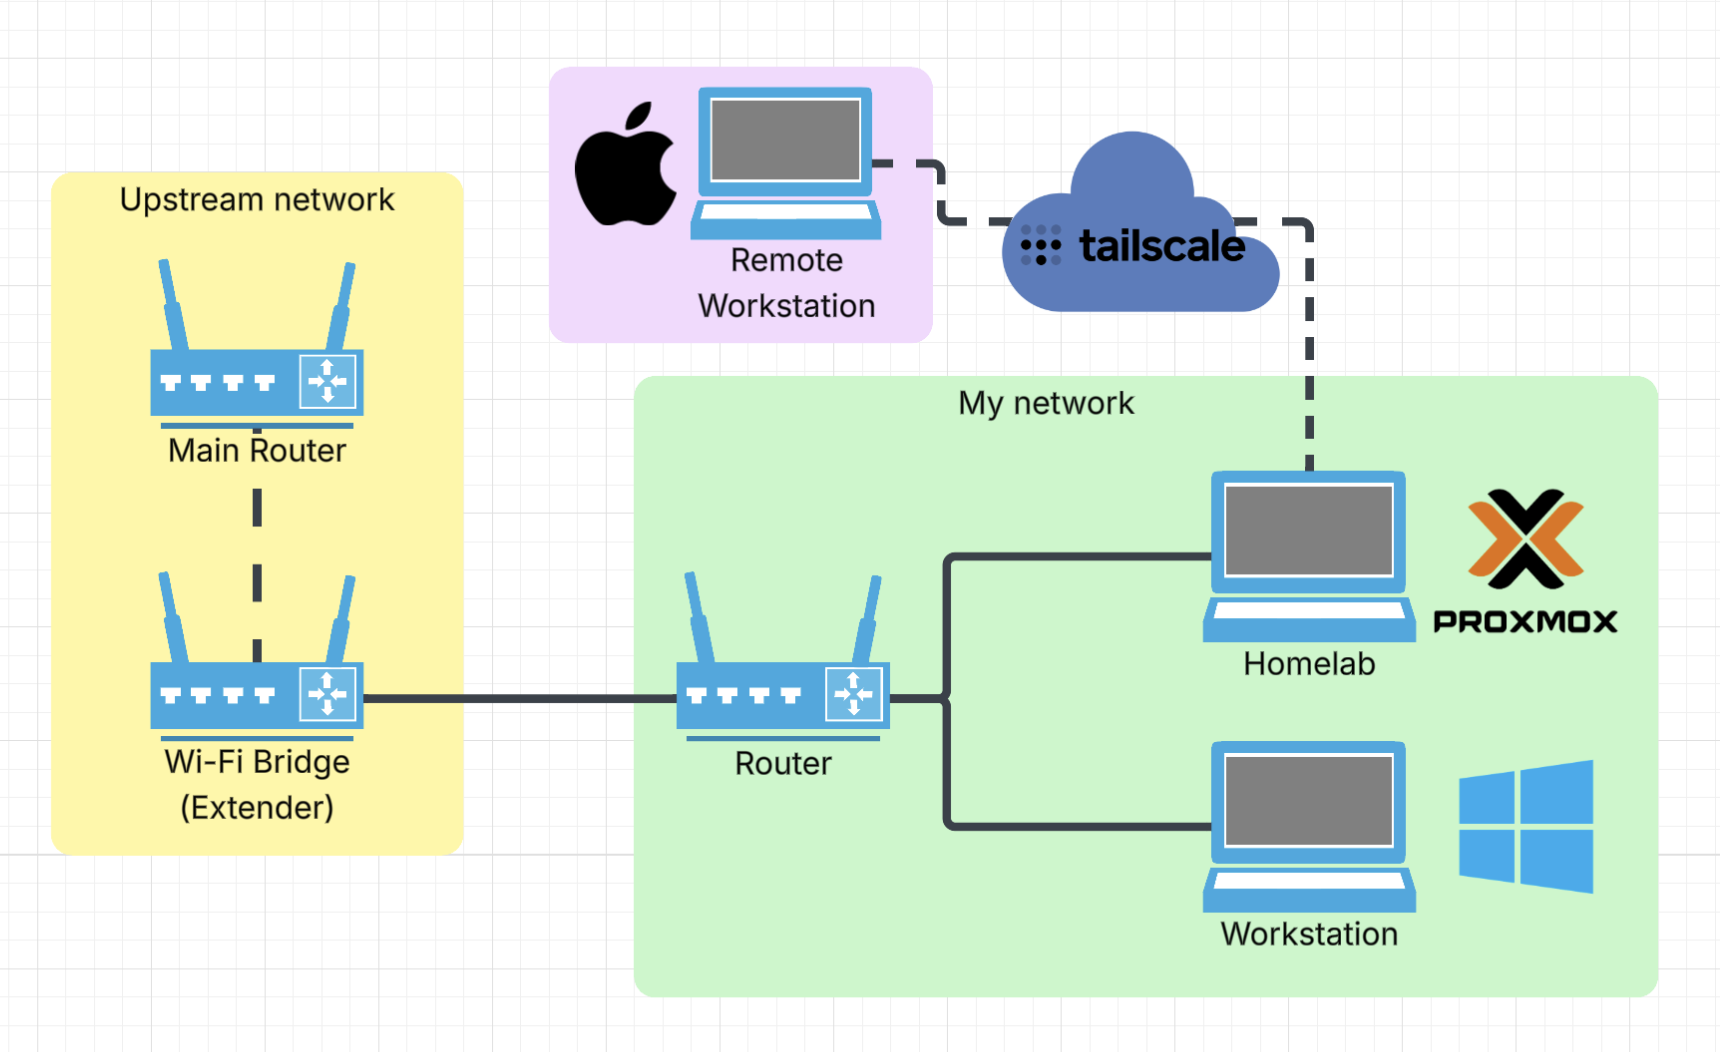
- Remote access via Tailscale subnet routing — no public exposure
- Fully declarative, YAML-configured cluster with Traefik ingress and Homepage dashboard
Why I built this
Reading about Kubernetes and infrastructure-as-code only takes you so far. At some point you need to actually run the thing, break it, and figure out why it's broken. That's what this is.
I'm studying cybersecurity and infrastructure, and I wanted real hands-on experience with the tools that actually show up in DevOps job descriptions — Terraform, Ansible, Kubernetes, Prometheus, ArgoCD. Not just read about them.
The hardware is a repurposed HP Elitebook 835 G7, a laptop that was otherwise going to gather dust. Running a full infrastructure stack on a single 16GB machine means you have to think carefully about what you're actually running and why.
The hardware & virtualization layer
The physical host is an HP Elitebook 835 G7:
- AMD Ryzen 5 PRO 4650U (6 cores / 12 threads, up to 4.0 GHz)
- 16 GB RAM
- 256 GB SSD
Proxmox VE is the hypervisor. Web interface for managing VMs, handles templates and resource allocation, and it's free — which for a home server makes it an obvious pick over something like ESXi.
The VM setup uses a Debian 12 cloud image as a base template. Cloning from it for each new node made provisioning fast and consistent, without reinstalling an OS every time.
Networking & remote access
The lab runs on its own network segment, separate from the upstream router.
The networking decision I'm most happy with is Tailscale with subnet routing. Instead of installing Tailscale on every VM individually, Proxmox acts as a subnet router and advertises the whole 192.168.x.0/24 network. Every VM is reachable by its local IP from anywhere, no SSH tunneling required. The alternative was poking holes in the firewall for each service, which seemed like the wrong direction.
Kubernetes cluster (k3s)
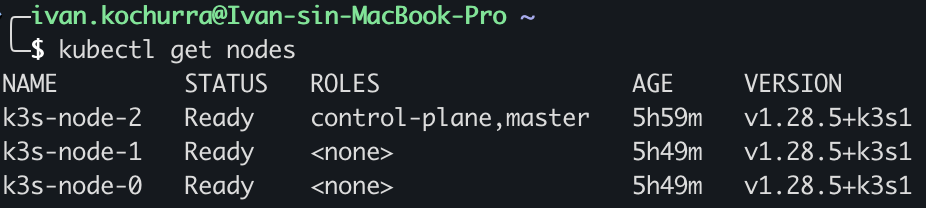
For Kubernetes I went with k3s, a lightweight production-grade distribution that doesn't need a lot of resources to run. Three nodes: one master, two workers.
Provisioning is fully automated. Terraform creates the VMs from the Debian 12 template in Proxmox. Ansible (using the k3s-ansible community playbook) installs k3s across all three nodes.
The whole cluster can be torn down and rebuilt from scratch. No manual steps, no mystery config sitting on one node but not the others.
Monitoring stack
Monitoring runs on a dedicated VM.
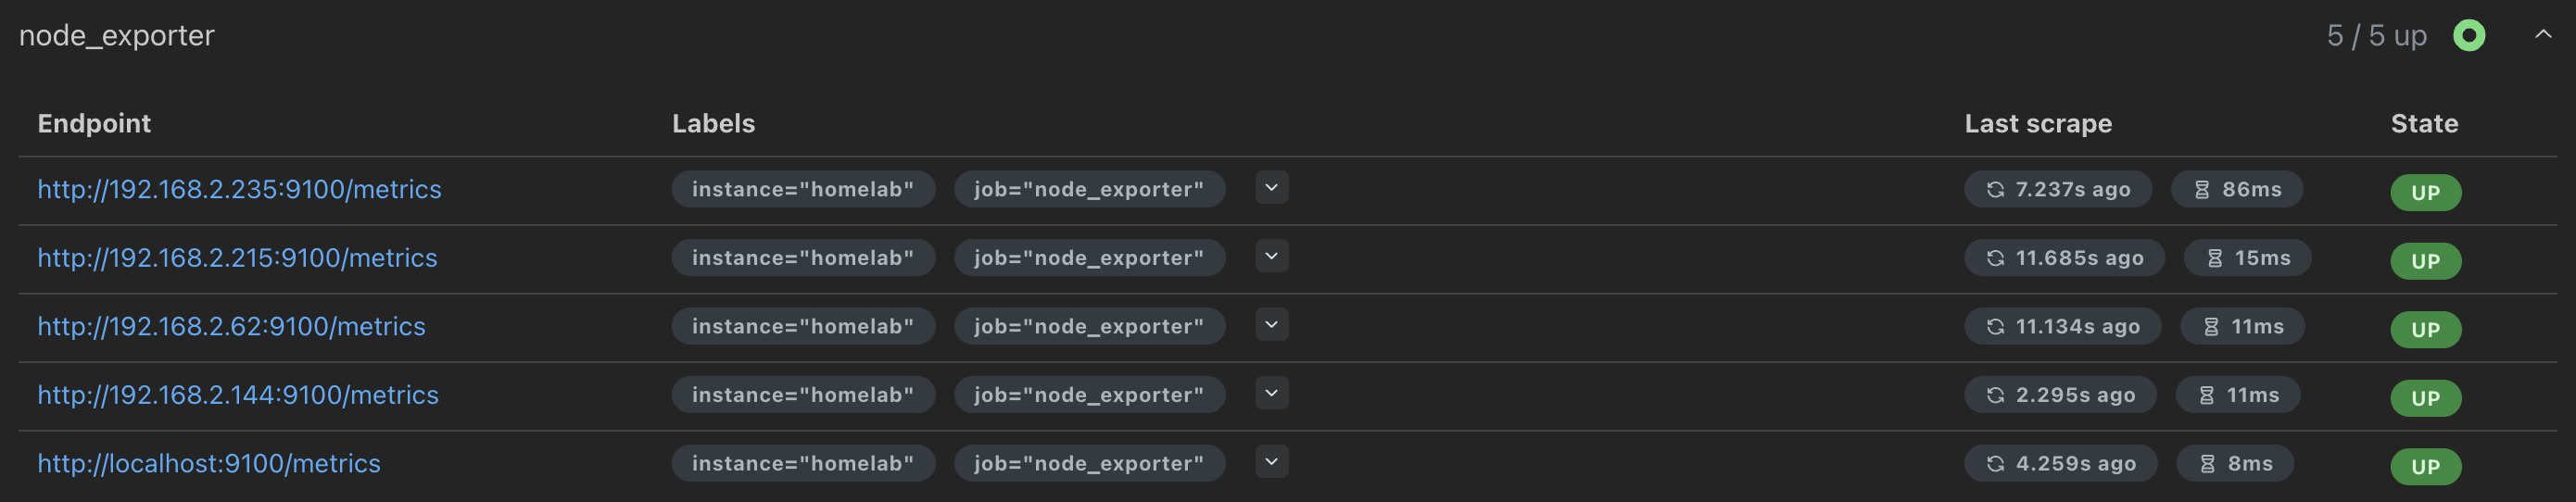
Prometheus collects metrics from all nodes. Node Exporter runs on every host (Proxmox, master, both workers), deployed via the same Ansible inventory already set up for k3s. The Windows workstation is also in there via windows_exporter, so everything shows up in one Grafana instance.
Grafana is the visualization layer. The Windows dashboard took more work than expected. Most community dashboards were built for older metric formats and half the panels were broken. I pulled the actual metric names from Prometheus and rebuilt the dashboard JSON from scratch. Took a while, but now it works.
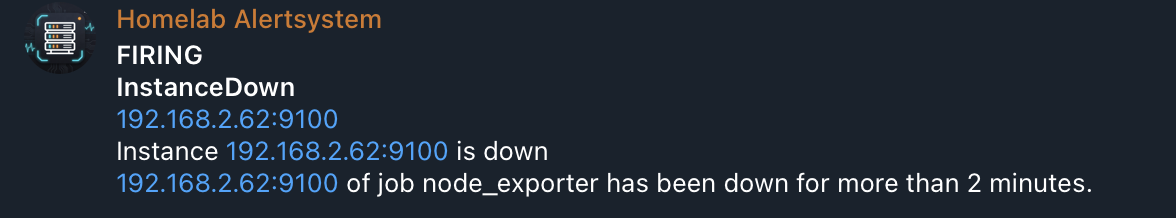
Alertmanager handles routing. Newer versions have native Telegram support built in, no third-party plugins needed. Alert rules cover node downtime, with label-based exclusions so the workstation (which I shut down regularly) doesn't fire alerts every evening.
There's also a custom Python Telegram bot running as a systemd service, with a few commands for quick status checks:
/status— which nodes are up/cpu— current CPU usage/memory— memory usage/disk— disk space
One of my favorite parts of the setup. Checking on the lab from a phone without opening Grafana is more practical than I expected.
GitOps pipeline
ArgoCD runs on the cluster and watches a private GitHub repo structured with App-of-Apps, where one root application manages all the others. Any change to the repo gets synced to the cluster automatically.
Traefik is the ingress controller (comes pre-bundled with k3s). Getting ArgoCD behind it was annoying. ArgoCD forces HTTP to HTTPS, which breaks standard ingress rules. The fix was IngressRouteTCP with TLS passthrough, so Traefik forwards traffic to ArgoCD without touching the TLS handshake.
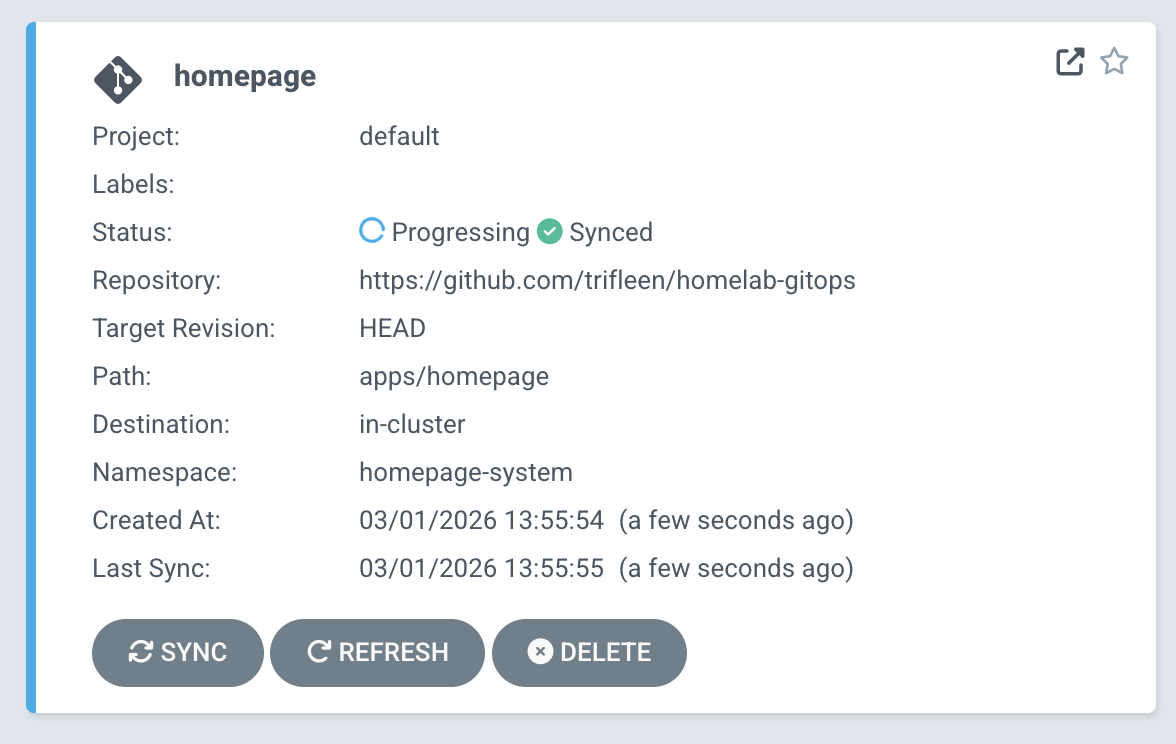
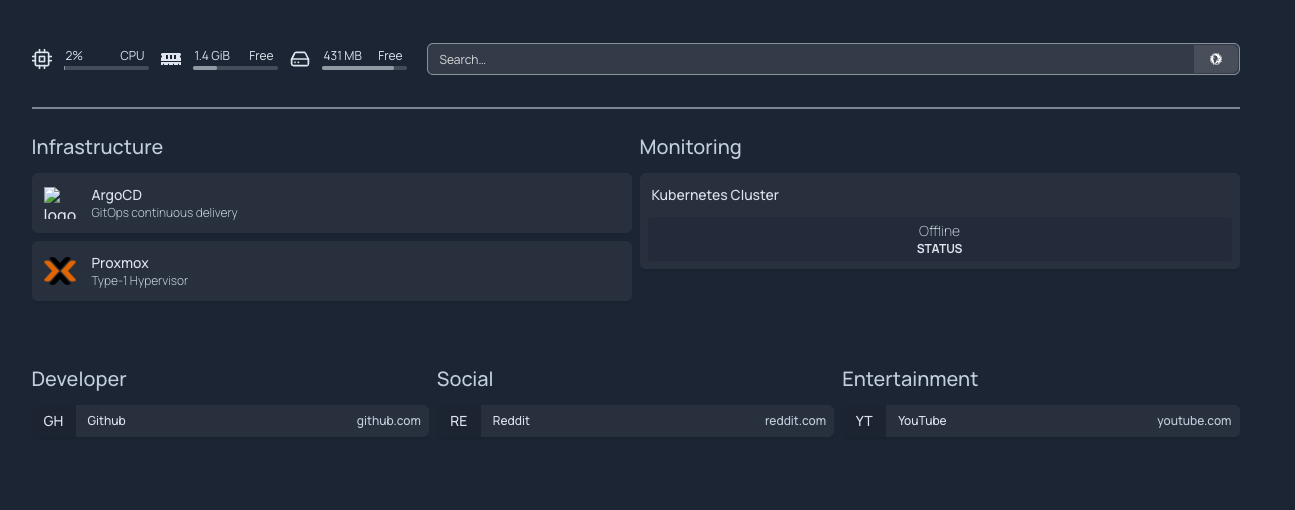
The first app deployed through ArgoCD is Homepage, a dashboard that's entirely YAML configured. To update it, I push a commit. ArgoCD picks it up and syncs the cluster. No manual kubectl apply, no wondering whether what's running matches what's in the repo.
More trial-and-error than I'd like to admit went into getting here, but having the git repo as the single source of truth for everything on the cluster is genuinely satisfying.
Tech stack
| Category | Tools |
|---|---|
| Virtualization | Proxmox VE, Debian 12 |
| Infrastructure as Code | Terraform, Ansible |
| Container Orchestration | k3s (Kubernetes), kubectl |
| Monitoring & Observability | Prometheus, Grafana, Alertmanager, Node Exporter |
| Alerting & Automation | Alertmanager (Telegram), Python (custom bot) |
| GitOps & CI/CD | ArgoCD, GitHub |
| Networking | Tailscale (VPN, subnet routing), Traefik (ingress) |
| Dashboard | Homepage |
What I learned & what's next
Documentation doesn't prepare you for the actual failure modes. Deploying k3s with Ansible, you run into DNS resolution quirks, configmap ordering issues in ArgoCD sync waves, YAML that behaves differently than the docs suggest. The only way to really get it is to break something and trace it back.
The thing that clicked for me is how these tools connect. Prometheus on its own is just a database. It only does something useful when exporters feed it and Alertmanager routes its output somewhere. ArgoCD isn't really deploying things — it's constantly checking whether reality matches the repo and correcting the difference. You can read that in a doc, but it doesn't fully register until you've watched it happen.
What's next:
- PostgreSQL for stateful workloads
- Pi-hole for local DNS
- More storage (looking at a NAS or RAID setup)
- Local LLM access through the main workstation GPU via Ollama
More things to configure, more things to break, more things to fix. Which is kind of the whole point.